Following up on yesterday’s post about the CDC reporting that 349 children, ages 0-17, having died from COVID-19 in the United States of America, I thought you might be curious how that pans out closer to home, here in my state of Indiana.
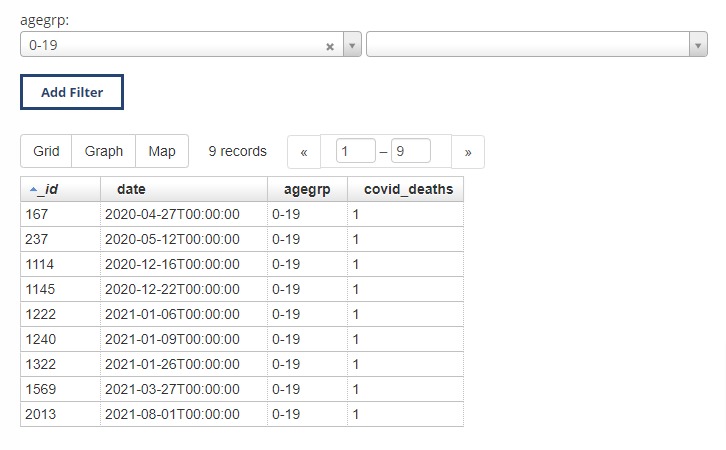
To date, there have been a total of NINE reported COVID-19 deaths in people 19 and under (feel free to explore the dataset for yourself).
Due to Indiana State Department of Health reporting with this dataset, we do not know how many, if any, of those nine deaths fall into the 18 & 19-year-old age group. Nor do we know what co-morbidities, if any, that they had.
For reference, the Indiana State Department of Health reports that there have been 13,661 total COVID-19 related deaths in the state of Indiana.
76% of those were 70 or older, 91% of those were 60 or older, and 97% of those were 50 or older.
Leave The Children Alone!
So I ask yet again, why are we subjecting the children to masks and quarantines and trying to pump them up with a vaccine?
We have three vaccines that aren’t even thoroughly tested and approved by our own government! Two of which are still considered experimental technology.
If those who fall into the older crowd opt to get the vaccine, that’s fine as long as nobody is forcing it on any of us.
As adults, we’ve lived life a bit and can make that decision based on the facts. And we can take responsibility for our own actions, something not common these days.
But to encourage the shot for children at all seems downright ludicrous to me. It’s reckless.
In general, the children have no need for it based on the data we now have. Heck, most people under 50 don’t really need it either.
In the event that a child needs it, as suggested by their personal doctor, that’s fine, but it cannot be a blanket stance for all children.
When the people on the “fringe” start making more sense than the medical community, the government, and the media, we have a real problem. FIX IT NOW!!!
Overall COVID-19 Deaths in Indiana
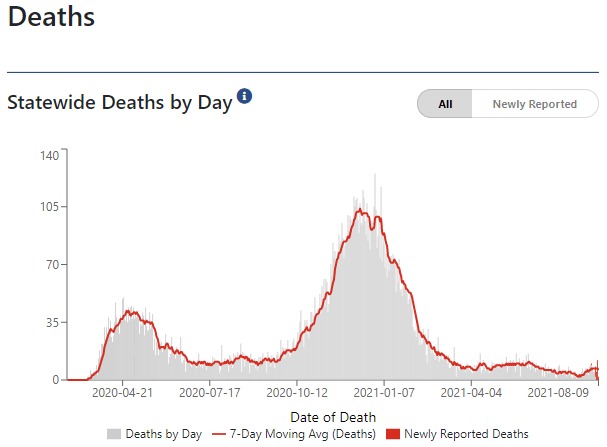
To see the overall daily COVID-19 related deaths in Indiana, let’s take a quick look at the chart from the Indiana State Department of Health COVID-19 Dashboard.
If you’ve ever looked at the charts of previous virus outbreaks, you’ll recognize that this is playing out as virus outbreaks typically do.
Wave 1: Typically a spike in death and recognition of what is going on.
Wave 2: Typically the highest peak of death which then trails off for a bit.
Wave 3: Typically another spike more along the lines of Wave 1. Based on the charts, this appears to be where we are right now. An uptick is coming.
After Wave 3, things usually become “seasonal” and fade a bit.
There are a million different theories out there about COVID-19, the truth of which is yet to be told. So we shall see how things progress from here.
That said, I’m not a doctor or scientist, so PLEASE DO YOUR OWN RESEARCH.
And PLEASE, QUESTION WHAT YOU’RE BEING TOLD.
Many of the “experts” being marketed to us are no more an expert than your local butcher, garbage man, or myself.
The Great Influenza: The Story of the Deadliest Pandemic
For further reading, I highly recommend The Great Influenza: The Story of the Deadliest Pandemic by John M. Barry (affiliate link). This is well written and reads more like a novel than a history book. And it will make it clear that COIVD-19 is nowhere near what the Spanish Flu was.


