While I’m on my COVID-19 (Coronavirus) kick (see CDC: 349 Children Have Died from COVID-19 in the U.S.A. and 9 Indiana Children Have Died From COVID-19), let’s explore the current Indiana COVID-19 demographic distributions by age group for tests, positive cases, and deaths.
All data listed below are from the Indiana State Department of Health COIVD-19 Dashboard located at coronavirus.in.gov and pulled on August 11, 2021.
And I’ll offer a warning. For whatever reason, the Indiana State Department of Health is obsessed with percentages for these charts and does not offer actual finite numbers here.
Also, I’m including the gender data for those curious about it, but I’m not going to discuss it.
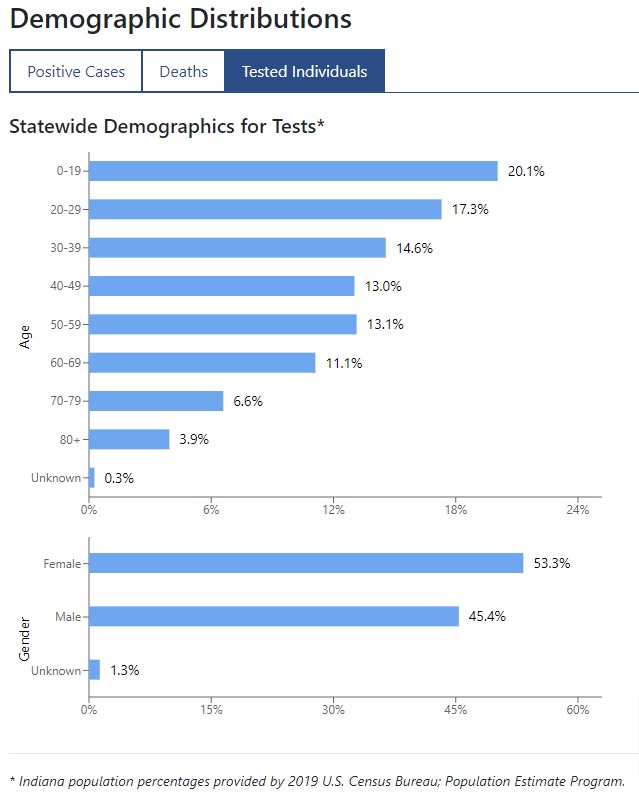
Indiana COVID-19 Demographic Distribution by Age for Tested Individuals
When it comes to taking COIVD-19 tests, the younger crowd has it nailed!
Of course, there are more younger people than older people, and schools have gone overboard with “contact tracing” and requiring kids to get COIVD-19 tests just because. But hey, that helps overall positive percentages go down as the kids don’t usually have COIVD-19. Math is funny that way.
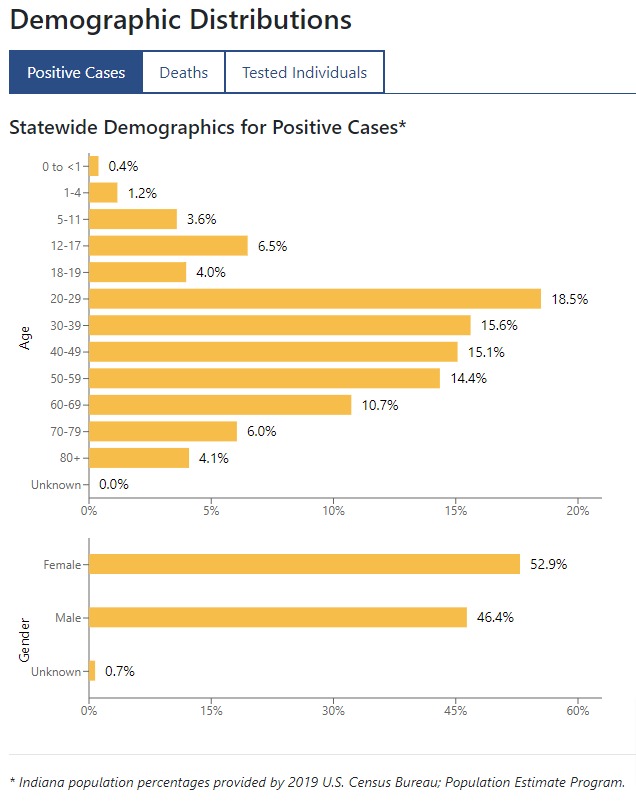
Indiana COVID-19 Demographic Distribution by Age for Positive Cases
Looking at where the positive cases are, I can’t say that anyone should be surprised.
Children go to school and are involved in a few activities. Close quarters, sure, but they’re either not catching COVID-19, or it’s so mild that it doesn’t really register.
In your 20s you’re interacting with A LOT of people. You’re busy. You’re living your life and figuring things out.
In your 30s, 40s, and 50s you start to settle down a bit. You’re busy doing things with or for your kids, then eventually your young grandkids. You’re enjoying life while you’re still relatively young.
In your 60s and beyond, you start slowing down a bit more. And to be blunt, there are fewer people in these age groups as the years go by. Ailments will hit us all as we age, some of which are worse than others. And some of which will be our demise.
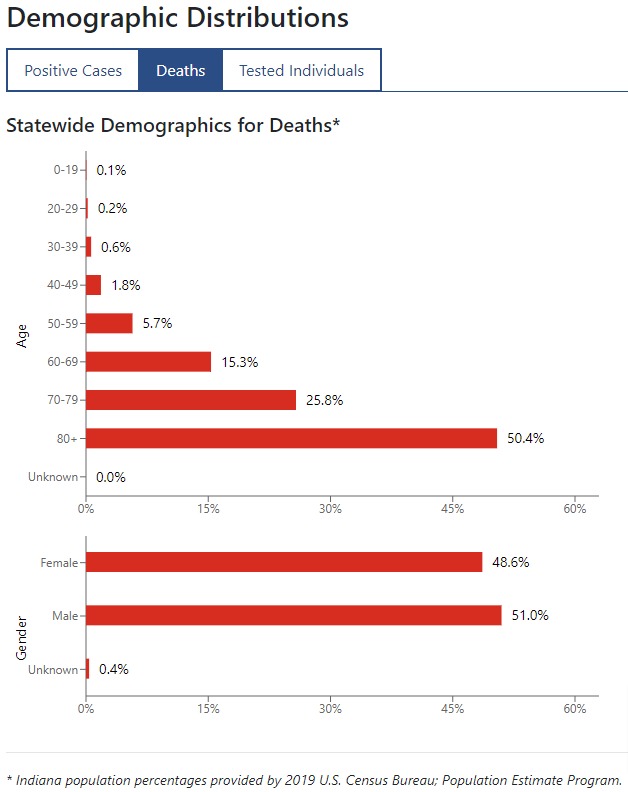
Indiana COVID-19 Demographic Distribution by Age for Deaths
Now let’s look at our deaths in Indiana that have COVID-19 listed as the cause of death or a co-morbidity.
As we’ve seen from very early on, the older you are, the more likely it is that COVID-19 is your enemy. Much like how older people often die from complications of seasonal influenza.
While the percentage of deaths gets higher the older you get, it should also be noted that those percentages are a bit misleading since there are fewer older people than younger people.
Again, talking in percentages isn’t always helpful since you can spin numbers any which way you wish, but that is the way of the Indiana State Department of Health. I could dig up the actual numbers from other state sources, but you get the gist.


